
A disaster does not affect every place, household or
community in the same way. Two areas may experience the same flood depth,
cyclone intensity or earthquake magnitude, yet the consequences can be very
different depending on population, infrastructure, livelihoods, access to
healthcare, mobility and social vulnerability.
This is where GIS can move disaster management beyond
hazard mapping—towards people-centred disaster risk intelligence.
Traditional hazard maps primarily answer one question: Where
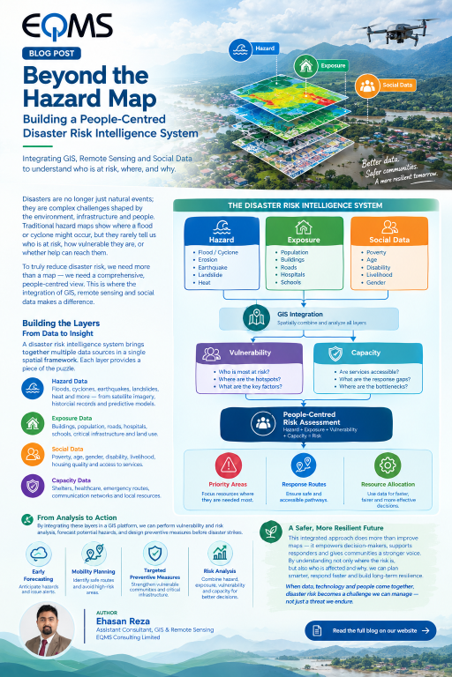
is the hazard? A more integrated geospatial approach asks several
additional questions: What is exposed? Who is vulnerable? What resources are
available? How can people move to safety? And where should preventive action
begin?
UNDRR identifies hazard, exposure and vulnerability as core
components of disaster risk assessment, while emphasizing the importance of
geospatial information for understanding where hazards intersect with people,
assets and infrastructure. UNDRR
1. From Hazard Data to a Spatial
Understanding of Risk
The first layer is hazard intelligence.
GIS allows us to spatially represent the physical
characteristics and distribution of hazards. Flood extent, flood depth, river
erosion, cyclone tracks, storm surge, landslide susceptibility, earthquake
hazard, extreme rainfall and heat exposure can be represented as spatial
datasets.
These datasets can be developed from multiple
sources—including satellite imagery, DEMs, rainfall observations, historical
disaster records, hydrological models, UAV surveys and other geospatial
technologies.
The result is not simply a map showing that a hazard exists.
It creates a spatial understanding of where, when and with what intensity a
hazard may occur.
Recent research in coastal Bangladesh demonstrates this
direction: satellite-derived flood information can be combined with
environmental and socioeconomic variables and machine-learning approaches to
develop predictive flood-risk information. Frontiers
2. Exposure: Understanding What Is in Harm's
Way
Knowing where a hazard occurs is only one part of the
problem.
The next question is: what is located within that hazard
zone?
GIS can overlay hazard layers with population, buildings,
roads, bridges, schools, hospitals, markets, agricultural land, industries and
other critical infrastructure.
This produces an exposure assessment.
For example, a flood-risk map can be intersected with
population data to estimate how many people are located within potentially
affected areas. Similarly, road networks can be analyzed to identify which
transportation links may become inaccessible, while hospitals and emergency
facilities can be examined to understand potential service disruption.
UNDRR defines exposure as people, infrastructure, housing,
production capacities and other assets located in hazard-prone areas. UNDRR
Therefore, GIS transforms the question from “Where will
the flood occur?” to “How much of our population, infrastructure and
livelihood system lies within the flood-affected area?”
3. Adding the Human Dimension: Social
Vulnerability
But exposure alone still does not tell the complete story.
A community's ability to withstand and recover from a
disaster can vary significantly. This is where social data becomes essential.
Population age, poverty, disability, gender, household
characteristics, livelihood dependency, housing conditions, education,
healthcare access, communication access and other socioeconomic indicators can
be integrated into a GIS environment.
When these datasets are spatially combined with hazard and
exposure information, we can identify areas where physical hazard and social
vulnerability overlap.
For example:
High Flood Hazard + High Population Exposure + High
Social Vulnerability
may indicate a substantially different risk situation from
an equally flooded area with fewer people and stronger access to services.
This approach makes the analysis more people-centred.
UNDRR's current disaster-risk assessment guidance specifically emphasizes
people-centred risks, critical service systems, data suitability and risk
prioritization. UNDRR
4. From Risk Analysis to Forecasting
The real value of an integrated system emerges when it moves
from describing past disasters to supporting anticipatory action.
Historical hazard data, satellite observations, rainfall,
river conditions, terrain, land use and socioeconomic information can be
combined with statistical or machine-learning models to identify areas with
elevated future risk.
GIS provides the spatial framework; forecasting models
provide predictive capability.
This distinction is important: GIS itself does not
forecast a disaster, but it provides the environment in which forecasting
models, real-time observations and spatial datasets can be integrated and
interpreted.
For Bangladesh, this can support flood-risk forecasting,
cyclone preparedness, erosion monitoring and other hazard-specific early-action
systems. Recent GeoAI research in Lakshmipur, for example, used satellite
observations alongside environmental and socioeconomic variables to predict
flood risk and identify population and cropland exposure. Frontiers
5. From Forecast to Preventive Action
Forecasting becomes meaningful when it leads to action.
If a model indicates that a particular area may experience
severe flooding, GIS can help identify safe evacuation routes, vulnerable
communities, accessible shelters, hospitals, alternative roads and priority
response locations.
Mobility analysis can determine which routes may remain
accessible and which communities could become isolated. Network analysis can
identify alternative routes to critical facilities. Accessibility modelling can
reveal areas where emergency services may face longer response times.
This creates a chain:
Forecast → Vulnerability Assessment → Mobility Analysis →
Preventive Measures → Response Planning
Instead of waiting for disaster impacts to appear on the
map, decision-makers can use the map to act before the impacts occur.
6. Towards People-Centred Disaster Risk
Intelligence
The future of disaster risk assessment is therefore not
simply about producing more maps.
It is about connecting Hazard + Exposure + Social
Vulnerability + Capacity within one spatial decision-support framework.
The objective is to understand not only where the hazard
is, but who is exposed, why they are vulnerable, what services are
available, how they can move, and where preventive action can make the greatest
difference.
Such a system can continuously evolve—from preparedness and
forecasting to emergency response, post-disaster assessment and recovery.
The map becomes more than a representation of risk. It
becomes an instrument for anticipating risk, prioritizing action and protecting
people.
For a disaster-prone and rapidly changing country like
Bangladesh, integrating GIS, Remote Sensing, social data, mobility analysis and
predictive modelling can help transform disaster management from a largely
reactive process into a more anticipatory, evidence-based and people-centred
approach.
Because the most useful disaster map is not the one that
only shows where the hazard is. It is the one that helps us understand who is
at risk—and what we can do before the risk becomes a disaster.
Share this page via
More from Ehasan Reza